Mean, Median and Mode Compared
Definitions, formulas, the same data set worked three ways — and how to choose the right average for the question you are answering.
Quick definitions
- Mean — sum ÷ count. x̄ = Σx ÷ n. Uses every value.
- Median — the middle value of the sorted data (average of the middle pair for even counts). Uses position.
- Mode — the most frequent value. Uses counts — and works for categories too.
The three together are called the measures of central tendency: three different answers to "what is a typical value?" All three are returned from one paste by the mean median mode calculator.
For a study-guide version of the same ground — one data set worked all four ways, with the range added and practice questions at the end — see mean, median, mode and range.
Side-by-side comparison table
| Mean | Median | Mode | |
|---|---|---|---|
| Formula | Σx ÷ n | Middle of sorted data | Highest frequency |
| Uses | Every value | Order only | Counts only |
| Outliers | Strongly affected | Barely affected | Unaffected |
| Always exists? | Yes | Yes | No — and can be several |
| Non-numeric data? | No | No | Yes |
| Example below | 69,166.67 | 35,500 | None |
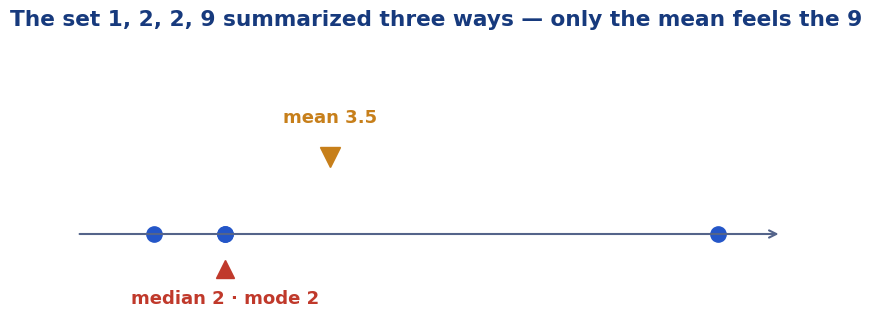
Same data, three answers
The salary set — $32,000, $34,000, $35,000, $36,000, $38,000 and one owner at $240,000 — produces a mean of $69,166.67 (the total $415,000 shared six ways), a median of $35,500 (the middle of the sorted salaries) and no mode (nothing repeats). Three summaries, three impressions: a recruiter quoting the mean would be technically accurate and practically dishonest. By contrast, in the nearly symmetric test-score set (78, 85, 92, 85, 90, 76, 85, 94) the three nearly coincide — mean 85.625, median 85, mode 85 — because nothing extreme is distorting any of them.
Skewed data changes everything
When data is symmetric, the choice of average barely matters. When it is skewed — a long tail on one side — the mean migrates toward the tail while the median stays with the typical case, and the mode stays with the most common. The direction of the gap diagnoses the skew: mean above median means a right tail of big values; mean below median, a left tail of small ones. This is why comparing the three is a standard first step in exploring any new data set, before any chart is drawn.
Which average does the news use?
"Average temperature" is a mean of readings. "Average income" and "average house price" in official releases are usually medians, precisely because the mean would be dragged by the richest values. Sports averages (batting, scoring) are means over games. When a story just says "the average", the honest reader asks: which one, and who chose it? A campaign quoting mean income growth and a union quoting the median can both be telling the truth about the same year.
More guides
Frequently asked questions
What are the mean, median and mode?
The mean is the sum divided by the count; the median is the middle value of the sorted data; the mode is the value that appears most often. Together they are the measures of central tendency.
Can all three be the same number?
Yes. In the set 1, 2, 3, 3, 3, 4, 5 the sum is 21, so the mean is 3; the middle value is 3; and 3 appears most often — mean, median and mode all equal 3. Perfectly symmetric sets with a central mode behave this way.
Which average does the news use?
Usually the mean for temperatures and scores, and the median for incomes and house prices — because money data is skewed. When a report just says 'average', it is worth checking which one is meant.
What does it mean when the mode is far from the mean and median?
The most common value is not the typical middle experience — common with clustered data such as shoe sizes or exam grades bunched at a pass mark.