Measures of Central Tendency
The mean, median and mode are the three measures of central tendency — three different ways of naming the center of a data set. Here is what each one really measures, worked on the same numbers.
What "central tendency" means
Central tendency is the idea that a whole data set can be summed up by a single typical value — one number that stands where the data clusters. A class's test scores, a week of temperatures, a month of sales: each list is too long to quote in full, so we reach for a center. Statistics offers three standard ways to find it, and they are called the measures of central tendency: the mean, the median and the mode.
Each measure answers a slightly different question. The mean asks what every value would be if the total were shared out equally. The median asks what the middle value is once the data is sorted. The mode asks which value shows up most often. Because the questions differ, the answers can differ too — sometimes by a little, sometimes by a lot — and choosing the right one is a judgment, not a formality. Our mean median mode calculator returns all three from one paste, which is the honest way to look at any data set: compare the centers before you quote one.
The three measures at a glance
| Measure | What it asks | How it is found | Its weakness |
|---|---|---|---|
| Mean | If the total were shared equally, what would each get? | Add all the values, divide by the count | Pulled around by extreme values (outliers) |
| Median | What is the middle value? | Sort the values, take the middle one (or the average of the middle pair) | Ignores how large the other values are |
| Mode | What shows up most often? | Count how often each value appears | May not exist, or may not be near the center at all |
Two of the three — the mean and the median — always exist for numerical data and always fall inside the data's range. The mode is the odd one out: a set can have one mode, two modes (bimodal), several (multimodal) or none at all, and the mode is the only measure that also works for non-numerical data, like the most common shoe size or the busiest weekday.
One data set, three answers
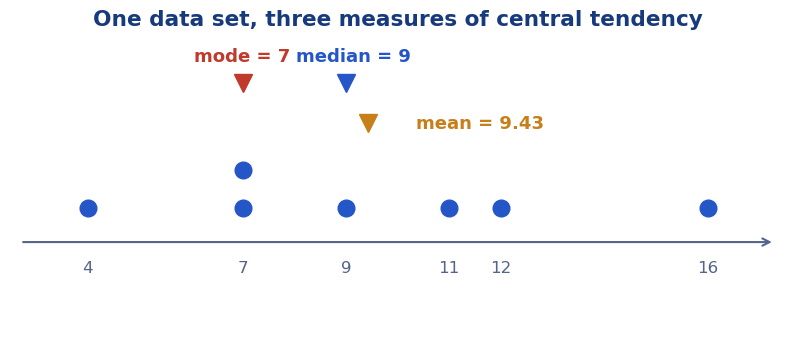
Take seven daily temperatures: 4, 7, 7, 9, 11, 12, 16. The mode is 7 — it is the only value that appears twice. The median is 9 — the set is already sorted, and the 4th of seven values sits in the middle. The mean is the sum, 66, divided by the count, 7: 9.43 (9.428… before rounding). Three measures, three answers — 7, 9 and 9.43 — and all three are correct, because each describes a different feature of the same week.
Notice the order they landed in. The single warm day (16) and the cold day (4) tug the mean slightly above the median, while the repeated 7 pulls the mode below both. On real data the three measures rarely agree exactly; the gaps between them are information about the shape of the data, not a sign that one of them is broken.
When the three agree — and when they part company
On symmetric data — values spread evenly around a center — the mean and median land on or near the same value, and the mode usually sits close by. That agreement is why symmetric data (test scores in a well-set exam, measurement errors, heights within one age group) can be summarized by the mean alone without misleading anyone.
Skewed data is where the measures split. Imagine six incomes: $28,000, $30,000, $32,000, $33,000, $35,000 and one at $120,000. The mean is $278,000 ÷ 6 = $46,333.33 — a figure nobody in the group earns anywhere near. The median, the average of the two middle values, is $32,500, which describes a typical income honestly. The one large value dragged the mean up by nearly $14,000 while the median barely noticed it. Our mean vs median guide works this comparison in depth, and the outlier guide shows how to spot the values doing the dragging.
The range is not a measure of central tendency
Students often meet four summaries together — mean, median, mode and range — and file them as one family. Three of them describe the center; the range describes the spread: how far the data stretches from smallest to largest. A center without a spread can mislead (two classes can share a mean of 75 while one is tightly packed and the other is all over the place), which is why full summaries pair a center with a spread — the median with the interquartile range inside the five number summary, and the mean with the standard deviation. Central tendency answers "where is the middle?"; spread answers "how much does it vary around that middle?" — both questions, every time.
Which measure should you report?
A working rule: report the mean when the data is roughly symmetric and every value genuinely counts — scores, temperatures, measurements. Report the median when a few extreme values would drag the mean away from the typical case — incomes, house prices, waiting times — and ideally quote the mean beside it so the skew is visible. Report the mode when the question is about frequency or categories — the most common grade, the best-selling size.
Whichever you choose, name it. "The average is 9.43" hides a decision; "the mean is 9.43, the median 9 and the mode 7" shows your working — and showing the working is the whole point of this site. The side-by-side comparison in our mean, median and mode compared guide takes the same data through all three in full.
More guides
Frequently asked questions
What are the three measures of central tendency?
The mean, the median and the mode. The mean is the sum of the values divided by the count; the median is the middle value of the sorted data; the mode is the value that appears most often. Together they are the standard ways of naming the center — the central tendency — of a data set.
What is the difference between central tendency and spread?
Central tendency describes where the center of the data sits (mean, median, mode). Spread describes how far the values stretch around that center (range, interquartile range, standard deviation). A complete summary gives one of each.
Which measure of central tendency is best?
It depends on the shape of the data. Use the mean for roughly symmetric data, the median when extreme values skew the data (incomes, house prices), and the mode for categories or frequency questions, like the most common shoe size.
Can a data set have no measure of central tendency?
Every numerical data set has a mean and a median, so it always has measures of central tendency. What a set can lack is a mode: if every value appears exactly once, there is no mode — the other two measures still exist.