Five Number Summary Explained
Minimum, Q1, median, Q3, maximum — how quartiles are found by hand, what the IQR measures, and how the five numbers become a box plot.
The five numbers
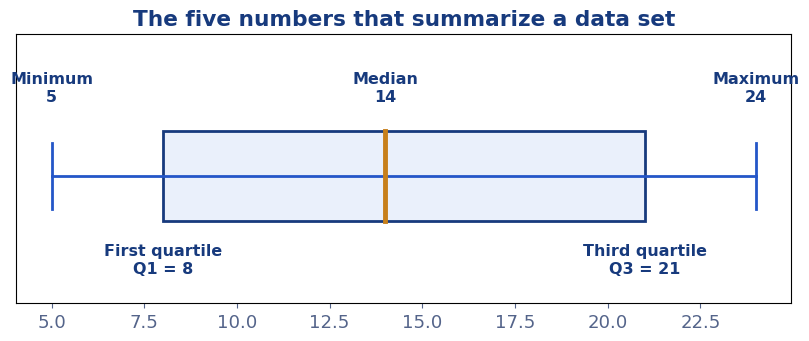
A five number summary describes a whole data set with five landmarks, in order: the minimum (smallest value), the first quartile Q1 (the value a quarter of the data sits below), the median (the middle), the third quartile Q3 (three-quarters point) and the maximum. Those five numbers locate the centre, frame the middle half of the data, and give the full span — enough to sketch the distribution without seeing a single raw value. The five number summary calculator produces them, plus the IQR and outlier fences, from one paste.
Finding quartiles by hand
Step 1 — Sort the data. Step 2 — Median: the middle value. Step 3 — Q1: the median of the values below the median. Step 4 — Q3: the median of the values above it.
For 12, 15, 18, 22, 25, 29, 31, 35, 40: the median is 25. The lower half is 12, 15, 18, 22, whose median is (15 + 18) ÷ 2 = 16.5 = Q1. The upper half is 29, 31, 35, 40, whose median is (31 + 35) ÷ 2 = 33 = Q3. Summary: 12 · 16.5 · 25 · 33 · 40. (Quartile conventions differ slightly between textbooks for very small sets; this median-of-halves method is the most common classroom approach, and our calculator shows the halves in its steps so the working can always be followed.)
IQR explained
Here: 33 − 16.5 = 16.5 — the width of the middle half of the data.
The interquartile range is the spread measure with armour on: because it spans only the central 50% of values, extremes and outliers cannot stretch it. It pairs naturally with the median ("median 25, IQR 16.5") the way standard deviation pairs with the mean, and it powers the standard outlier rule — fences at Q1 − 1.5 × IQR and Q3 + 1.5 × IQR — covered in what is an outlier?
From summary to box plot
A box plot is the summary drawn: a box from Q1 to Q3, a line inside it at the median, and whiskers extending to the smallest and largest values within the fences (values beyond the fences appear as individual dots — the outliers). Read it at a glance: the box's length is the IQR; the median line off-centre inside the box reveals skew in the middle half; long whiskers or dots reveal long tails. Every box plot you have ever seen in a report is five numbers wearing a picture.
Worked example
Putting it together for 12, 15, 18, 22, 25, 29, 31, 35, 40: min 12, Q1 16.5, median 25, Q3 33, max 40; IQR 16.5; fences at 16.5 − 24.75 = −8.25 and 33 + 24.75 = 57.75; no outliers (nothing outside the fences). The distribution is mildly right-spread in its upper half (Q3 − median = 8 vs median − Q1 = 8.5 — actually near-symmetric in the middle, with the extremes balanced too). That is a complete, honest description of nine numbers in one sentence — the entire point of the summary.
More guides
Frequently asked questions
What are the five numbers in a five number summary?
The minimum, the first quartile (Q1), the median, the third quartile (Q3) and the maximum of a data set.
How do you find Q1 and Q3?
Sort the data and find the median. Q1 is the median of the lower half of the data; Q3 is the median of the upper half (not counting the median itself in either half).
What is the five number summary of 12, 15, 18, 22, 25, 29, 31, 35, 40?
Minimum 12, Q1 16.5, median 25, Q3 33, maximum 40 — an IQR of 16.5.
How does a five number summary become a box plot?
The box spans Q1 to Q3 with a line at the median; whiskers reach to the minimum and maximum (or to the outlier fences, with outliers dotted beyond them).