How to Calculate Standard Deviation
Standard deviation measures how spread out your numbers are around their mean. This guide works one example all the way through by hand — then a smaller set you can check in your head.
What standard deviation measures
The mean tells you where the center of a data set is; the standard deviation tells you how far the values typically sit from that center. Two classes can both average 75 on a test while one is tightly packed between 70 and 80 and the other swings from 30 to 100 — same mean, completely different story. The first class has a small standard deviation; the second has a large one. Standard deviation is measured in the same units as the data (points, dollars, centimeters), which is what makes it easy to interpret and report. The standard deviation calculator does everything in this guide from one paste — the steps below are for doing it by hand, or for checking that a machine answer makes sense.
The standard deviation formula
For each value, subtract the mean and square the result; add the squares; divide — by n − 1 for a sample, by n for a whole population; then take the square root.
Every part of the formula earns its place. Subtracting the mean turns each value into a deviation — a distance from the center. Squaring does two jobs: it removes the minus signs (deviations below the mean would otherwise cancel the ones above) and it makes large deviations count for more than small ones. Dividing averages the squared deviations — that average is the variance — and the square root at the end undoes the squaring, returning the answer to the original units.
Step by step: the test-score example
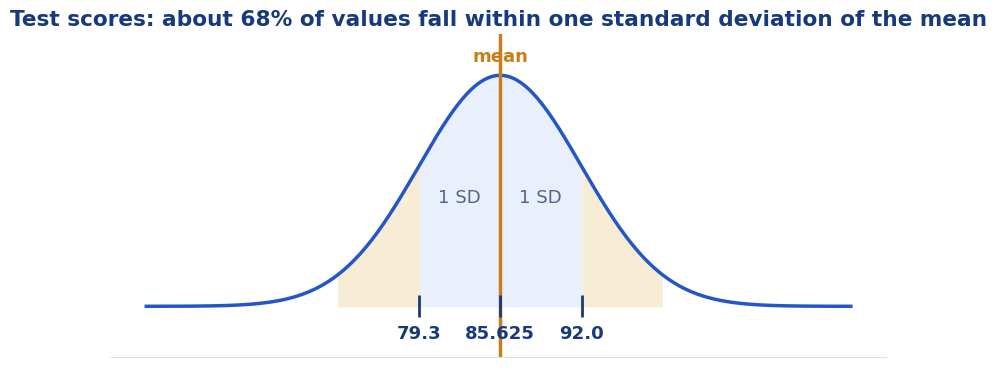
Eight students scored 78, 85, 92, 85, 90, 76, 85, 94. Step 1 — find the mean: the sum is 685 and the count is 8, so the mean is 685 ÷ 8 = 85.625. Step 2 — subtract the mean from each value and square the difference:
| Value (x) | x − mean | (x − mean)² |
|---|---|---|
| 78 | −7.625 | 58.14 |
| 85 | −0.625 | 0.39 |
| 92 | 6.375 | 40.64 |
| 85 | −0.625 | 0.39 |
| 90 | 4.375 | 19.14 |
| 76 | −9.625 | 92.64 |
| 85 | −0.625 | 0.39 |
| 94 | 8.375 | 70.14 |
Step 3 — add the squared deviations: the total is 281.875 (the table rounds each square to two decimals; the exact total is 281.875). Step 4 — divide: treating the class as a sample, 281.875 ÷ 7 = 40.27 — that is the sample variance. Step 5 — take the square root: √40.27 = 6.35. The sample standard deviation is s = 6.35 points: a typical score sits about 6 points from the mean of 85.625.
A small set you can check by hand
Shrink the data and the arithmetic gets friendly. For 2, 4, 4, 4, 5, 5, 7, 9: the mean is 40 ÷ 8 = 5. The deviations are −3, −1, −1, −1, 0, 0, 2, 4, and their squares are 9, 1, 1, 1, 0, 0, 4, 16 — a total of 32. Treating the set as a whole population, the variance is 32 ÷ 8 = 4 and the standard deviation is √4 = exactly 2. As a sample instead, the variance is 32 ÷ 7 = 4.57 and the standard deviation is 2.14. If your by-hand answer on this set is not 2 (or 2.14), the method — not the data — needs another look; it is the quickest self-check in this whole topic.
Sample or population: which divisor?
The only fork in the method is step 4. Divide by n when your data is the whole population — every member of the group you care about. Divide by n − 1 when your data is a sample standing in for a bigger group: a sample tends to huddle slightly closer to its own mean than the full population does, and the smaller divisor corrects for that (statisticians call the correction Bessel's). The sample answer is always the larger of the two — 6.35 against the population's 5.94 on the test scores above (281.875 ÷ 8 = 35.23, and √35.23 = 5.94). Our sample mean vs population mean guide explains how to tell which situation you are in.
Mistakes that quietly change the answer
Skipping the squaring — the raw deviations of any set always add to zero, so an unsquared "average deviation" is meaningless (the mean absolute deviation is the version that fixes this by using absolute values instead). Squaring the sum instead of summing the squares — the order matters: square each deviation first, then add. Rounding the mean too early — every deviation is built from the mean, so a rounded mean poisons the whole table; keep 85.625, not 85.6, until the final step. Reporting the variance as the standard deviation — 40.27 is the variance, in squared points; the standard deviation is its root, 6.35 points. The variance calculator shows both side by side so the pair never gets confused, and our mistakes guide covers the wider family of traps.
More guides
Frequently asked questions
What are the steps to calculate standard deviation?
Five steps: (1) find the mean; (2) subtract the mean from each value; (3) square each difference; (4) add the squares and divide — by n − 1 for a sample or n for a population — giving the variance; (5) take the square root. The result is the standard deviation, in the same units as the data.
Why do you square the deviations?
For two reasons: squaring removes the minus signs, so deviations below the mean cannot cancel the ones above (raw deviations always sum to zero); and it makes large deviations count for more than small ones, which matches how spread is usually judged. The final square root returns the answer to the original units.
What is the standard deviation of 2, 4, 4, 4, 5, 5, 7, 9?
The mean is 5 and the squared deviations add to 32. As a population, the variance is 32 ÷ 8 = 4, so the standard deviation is exactly 2. As a sample, the variance is 32 ÷ 7 = 4.57 and the standard deviation is 2.14.
Can standard deviation be negative or zero?
Never negative — it is a square root of an average of squares. It is zero only when every value in the set is identical, because then no value deviates from the mean at all.